If the sky is clear the number of star detections decreases the further your away from focus.
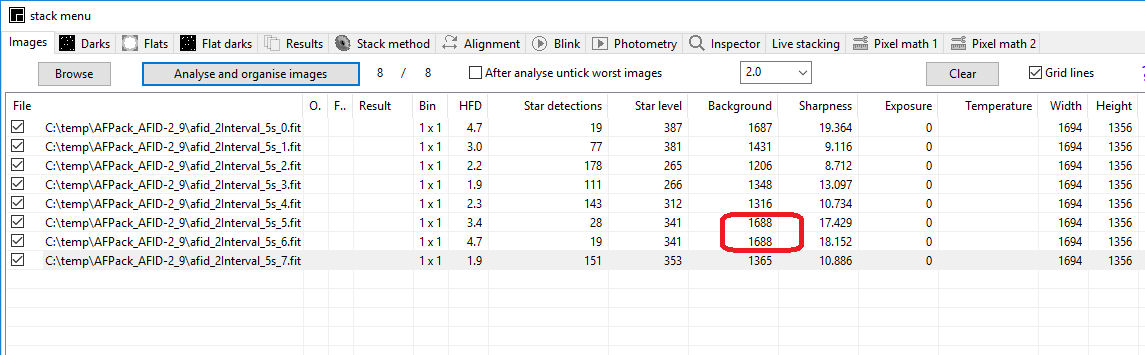
The images where taken while clouds where passing by and the number of detected stars where highly influenced by the clouds. The background value varies between 1206 and 1688. See screenshot below. The stars where simple getting fainter due to the clouds and faintest stars became undetectable. You can see it when you blink through the images. The slope between left and right side is changing. This doesn’t influence the focusing as long it detects one or more star.
Down sampling doesn’t effect the measurement as long the star is illuminating a few pixels at focus and the HFD is about 1.5 or higher.
For SGP I would set the priority to improve the star detection. The curve fitting is working well and best if you stay close to the focus.
I haven’t got any feedback back from PlaneWave about Platesolve2 but since we now this is technical feasible it is up the SGP team pick this or take an other route.
I agree. This was not a night for serious imaging but to my mind SGP AF with ASTAP metrics is now giving very consistent results in very marginal conditions so hopefully it will be almost bullet-proof when conditions are good. Also I think other SGP users will see a noticeable improvement when they try to focus with RGB and NB filters. In the past when I was trying to calculate for example filter offsets I found I was gettng widely dispersed results even when temperature was stable.
That is good to know. However that still leaves me wondering why the ASTAP metrics (#stars and HFD) are different when I manually load an AF image into ASTAP compared with the metrics reported in the SGP logfile immediately following capture of the same image? I don’t think I have made a mistake here and the discrepancies in the results are frequent and consistent. BUT having said this, the discrepancy does not seem to have significantly downgraded the AF results. I would just like to understand the reason for the differences. Is there any difference in ASTAP’s processing of images loaded by an API call versus manual loading?
I looked at the APT forum post above and it seems to me that the approach adopted by PWI AF is essentially the same as that being recommended with SGP AF. Unless PW have an undisclosed secret method in their AF implemetation I cannot see how their method should lead to a significantly different AF position when presented with the same AF image set.
As above I am currently unconvinced the PWI AF would give a majorly different result compared with a well written parallel implementation of the same analysis method. However it would be nice to get some decent data to settle the debate. I am wondering whether if I was to rename the image files in some of my AF image packs to match the PWI standard then if @Kurious_George or @Ross_Walker could possibly input these images to PWI3 to see what if any differences there are?
And of course it is for the Devs ultimately to decide whether or not to add a PWI3 method.
From what I have seen and read in the course of this discussion I am now reasonably convinced that the discrepancy in the AF result obtained using SGP+HFR compared with SGP+ASTAP HFD is likely almost entirely due to the sensitivity/accuracy of the relevant star detection and measurement routines. The SGP Devs could no doubt address this if they so wished but meantime I am very happy with the SGP/ASTAP method.
But that is not to say I am closed to the idea of further small improvements such as hyperbolic fit option!
If you bin2x2 the measured HFD values will be about half compared with unbinned vakues. At small HFD values (<=2) the HFD value will increase due to lower sampling and rounding, so I would expect that the binned HFD values be a little higher then half of the original values.
Processing the images should be the same for the command line and in the program itself. In the latest versions for HFD measurment ASTAP ignores saturated stars. If you find a significant difference between the command line results and in the program result tell me where so I can have a look.
Hyperbolic curve fitting will improve the result. The linear V-wings will fit perfectly with the hyperbolic curve, making is less susceptible to outliers.
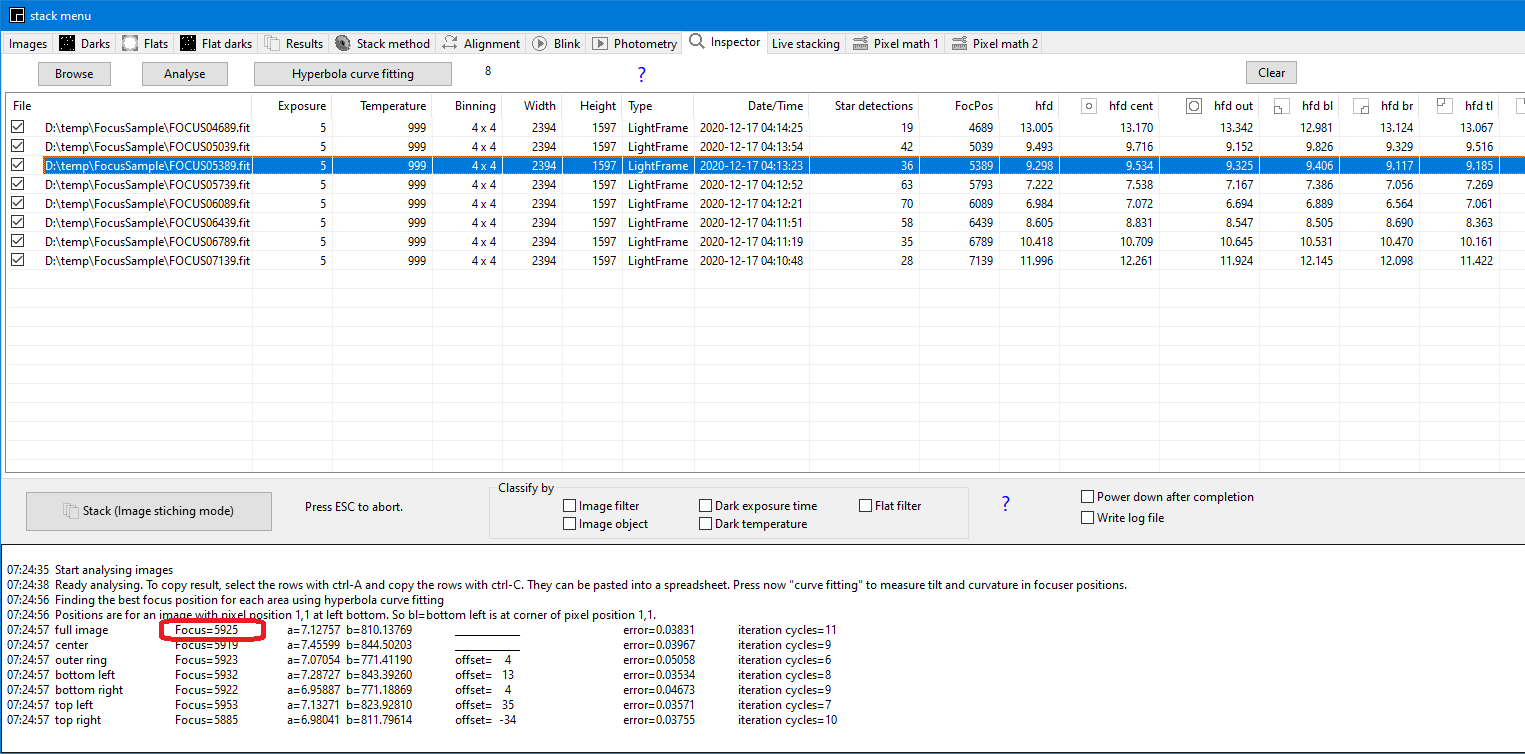
I’ve rechecked the SGP log for the period covering the capture and analysis of AF Pack 2-9, as loaded into the ASTAP screen-shot pictured above at post 141.
I am certain that the #stars and HFD values listed in the log do not correspond to those shown in the screen-shot.
I can currently think of two possible reasons for this:
On the Auto-Focus Options screen I have Crop AF frames by 5%. Maybe SGP is cropping the frame before passing it to ASTAP, rather than the full-frame as loaded in the screen-shot.
Maybe as a result of the AF parameter Min Star Size at 1x1, SGP is discarding some of the star detections I assume would be reported by ASTAP. In the SGP log it shows: Calculating HFR with sample size: 3. I have previously wondered about the relevance of this parameter with the ASTAP option.
It would be nice if Jared could provide the Devs assessment on this.
The ASTAP inspector tab was detecting all stars with an SNR>10. This is now adapted to the viewer CCD inspector and command line setting SNR>30. Stars with an SNR between 10 and 30 are less reliable for HFD measurement. The results should be now the same. The SNR minimum value can be set in the command line but is default 30. Could be used within SGP.
The SGP screen HFR values are from the internal routine. The csv file output containing all HFD measurements from ASTAP is not used by SGP version 3.651
Thanks for identifying the probable cause of the #stars discrepancy. According to the current forecast I may get a short period of clear sky this evening to do some more testing with .651 release. I am perhaps lucky but I have managed to download, install and connect to all my gear using both 32- and 64-bit versions. And I have downloaded your latest 0.9.459b release.
FWIW I have seen a couple of favourable comments (and none negative) wrt AF improvements using ASTAP as metrics provider so hopefully many other users will see improvement in the longer term.
As you say, current SGP release is still showing old SGP AF star detections and HFRs even when ASTAP is selected as the AF metrics provider. As this is a Beta release (and being aware of the issue) I don’t have a problem with this BUT longer term I think it would be better to have SGP correctly display ASTAP HFD detections when ASTAP is selected and SGP HFR detections otherwise.
Would ASTAP need to have capability to output an annotated image file (or star detection coordinates) for SGP to display when called from the command line, to facilitate this display?
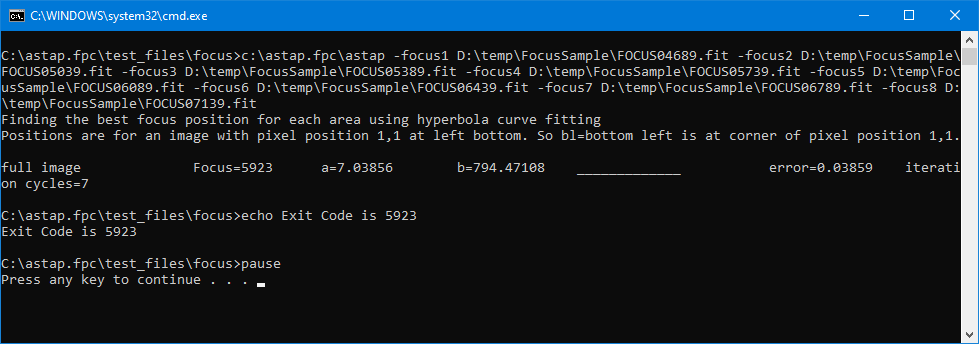
SGP has just to execute ASTAP with -extract option and the CSV output file contains the HFD X, Y for each detected star. You can also specify the minumum SNR value. So
ASTAP -f image.fits -extract
or to decrease the detection sensitivity from SNR>30 to SNR>10
ASTAP -f image.fits -extract 10
The output file will be image.csv. Can be read by any text editor or spreadsheet program. The median HFD is in the exit code but that is already implemented.
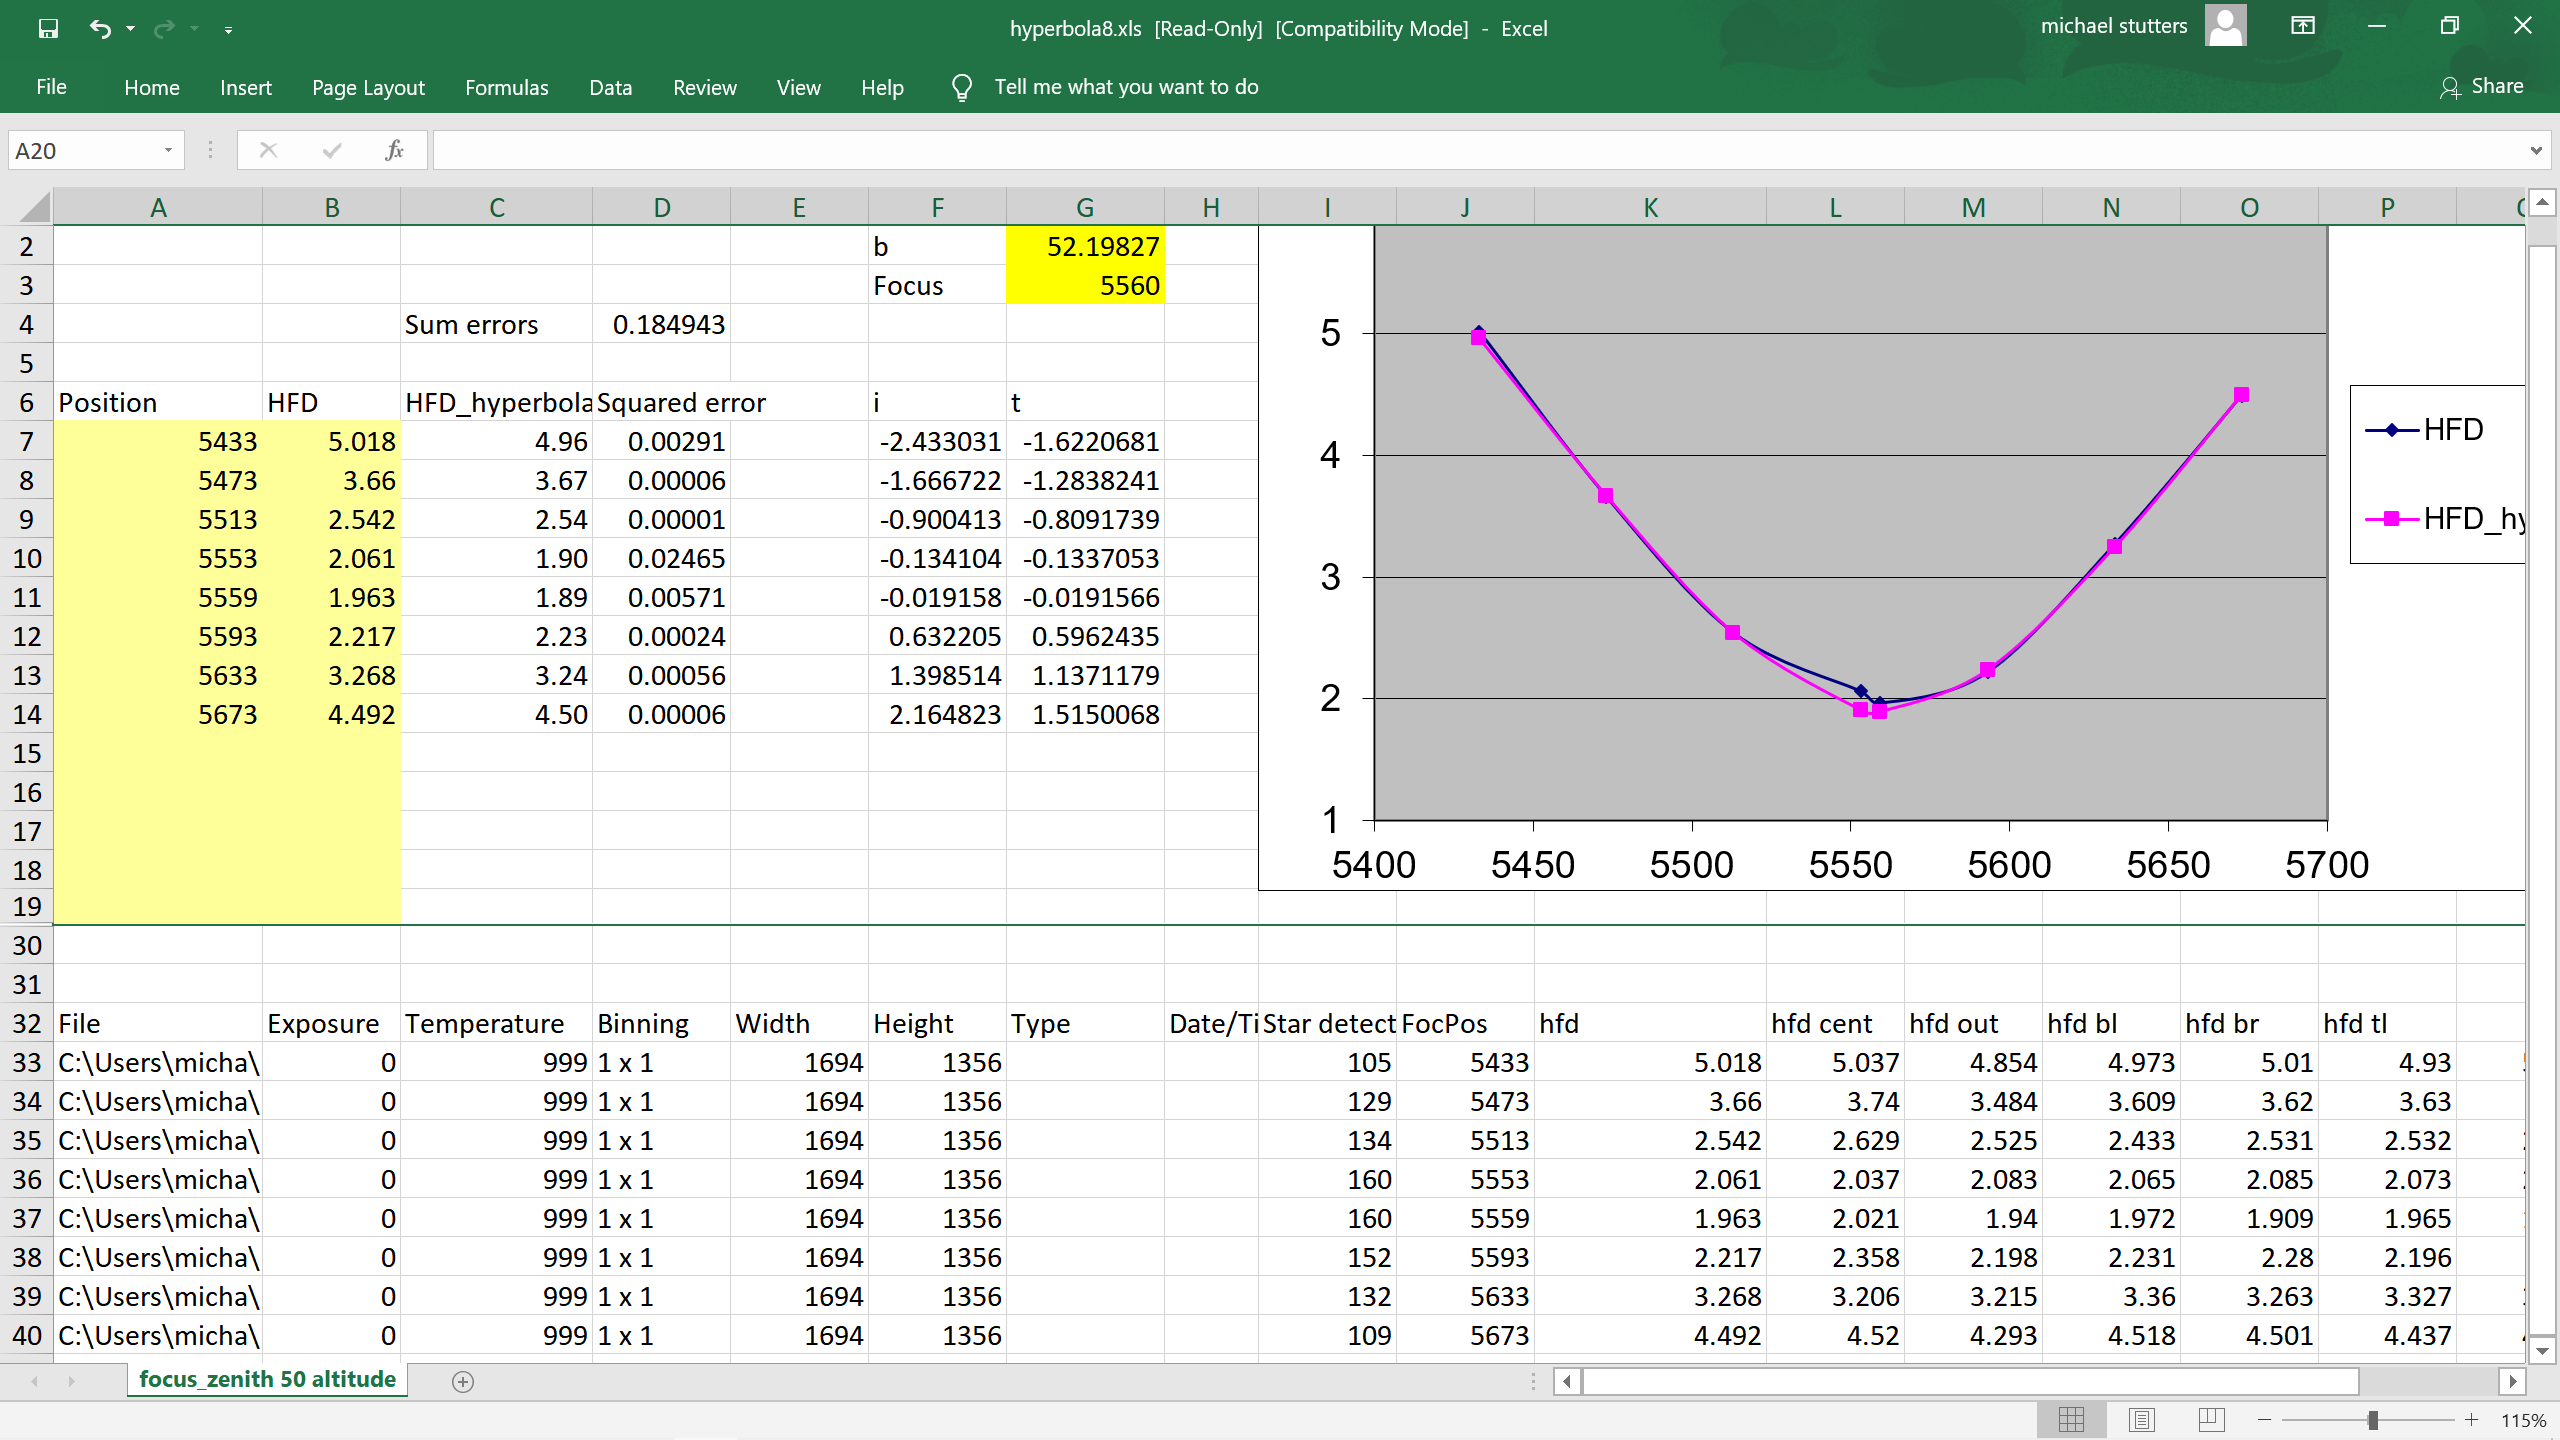
I take it the curve fit used in Excel is the same calculation as used in ASTAP but with the added ability to show the HFD and HFD Hyperbola curves?
Thinking about possible incorpration in SGP, the present parabolic fit method provides a quality measure for the curve fit that seems to me to be a useful feature. Is there something equivalent that can be provided with hyperbolic fit?
It is already available in the beta version of SGP. You only have to get SGP working with your setup. Note the individual screen values displayed are still SGP detection based.
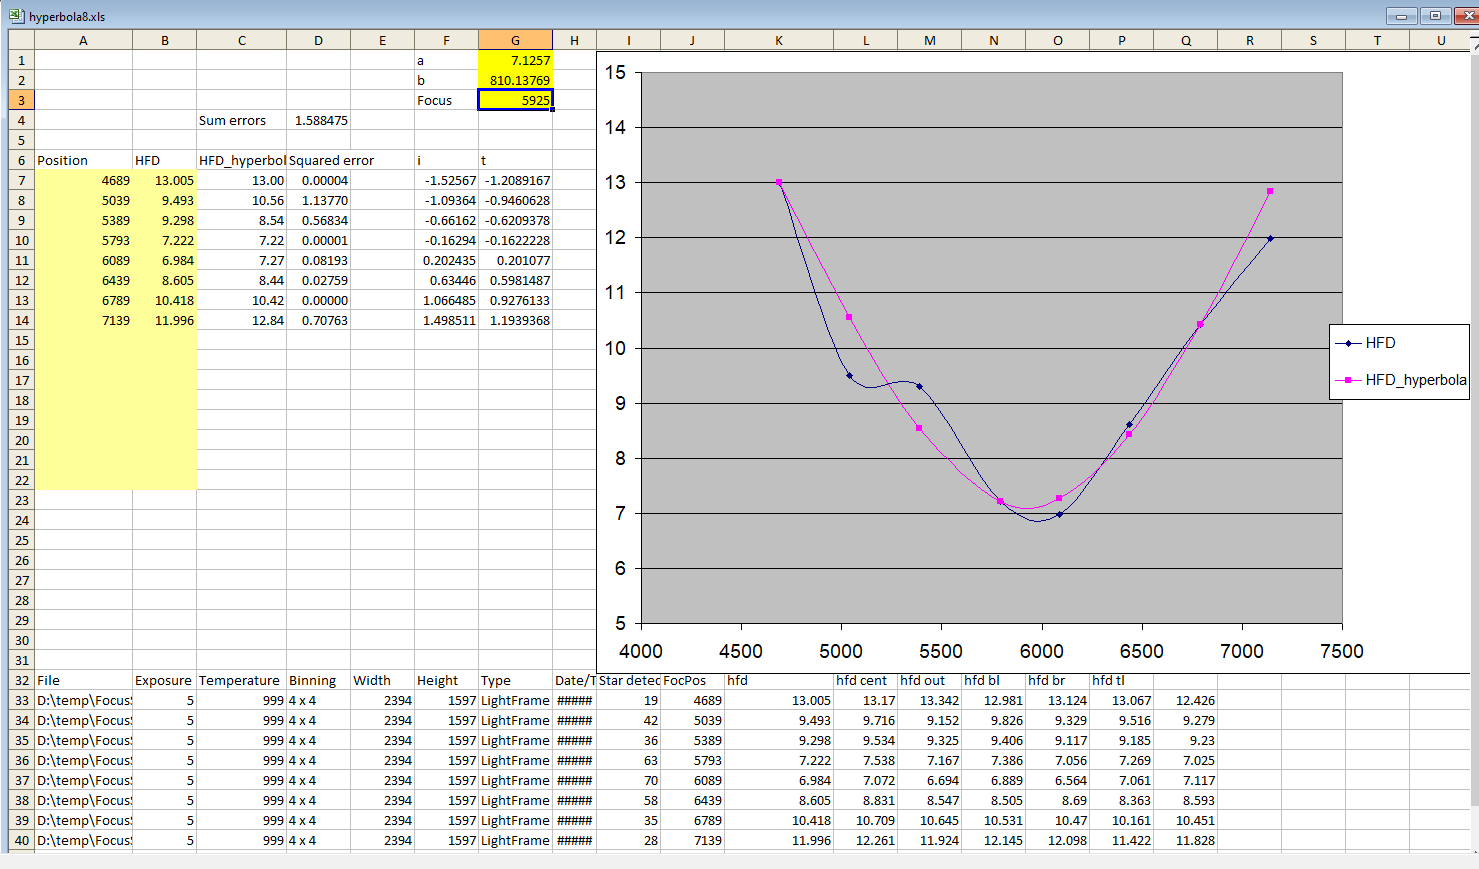
Yes, I take the three hyperbola parameters calculated in the ASTAP inspector tab and put them in the spreadsheet to produce the pink curve. The dark blue line is the smoothed curve drawn by the spreadsheet using the measured values.
The error for curve fitting is calculated by the differences between the measured points and the curve points. For ASTAP, I use a linear error so the curve is kind of average fit and outliers don’t get too much influence as with sqr(errors) . Furthermore you could limit the extreme outliers but don’t remove them because they could be correct. Applying statics and removing outliers doesn’t work in my opinion for these curve fitting but others have a different opinion.
But the existing parabolic fit will also work using the individual measured HFD values.
Assuming I have used your hyperbola8.xls correctly, I will be very happy if I can get AF curve fits as per this one! The slight discontinuity is from the Validation frame, which has yield a marginally better measurement than the earlier data point at 5553.
I am having the same issue with autofocus where the reported position differs 1-2 steps from the goto position. That this stops the sequence is frustrating.
Can we have a fix for this? Either by ignoring this or by being able to have a retry.
This is very annoying problem indeed. When your SGP focusing run is hanging on that 1 micron difference, you can press the “goto” -button in PWI focuser-tab and it moves the focuser to correct position, then focusing routine will continue.
The worst thing in this focuser bug is, that focusing run might work just fine for a week and then next week there is always this 1 micron mismatch in every focusing move.
Exactly the same here. I’ve commented elsewhere on the problem. I lose about 1 in 5 imaging sessions to the focus issue.
Voyager has an option to specify the number of steps away from target that are considered ‘on target’ for the focus motor. Either an explicit option or a tolerance built into the autofocus routine would be welcome.