If there were runs qualified as successful (i.e. quality factor > 90%) in your logfile there should have been a table with the data you seek in the main text window. Sounds like something went wrong while scanning the file. Please post a link to the file on this forum, and I’ll have a look.
The program can also read multiple logfiles and analyze for instance the focus position vs. temperature, or filter offsets, from multiple files. You simply select all files you want to analyze together in the open file dialog.
The runs were successful with fit Q from 94 to 99%. The table in the log app text window has the table of the final results for each run which is very useful. I cannot find the data used to make the AF plots, HFR vs. position. I like to use Excel to do some calculations on a variety of runs and make a different set of plots. Since you extract the data points from the focus run log, could you make the raw data available or exportable?
As always, if you experience problems or have suggestions for changes, please post a message here.
The changes made are these:
Version 1.23
FIXED BUG: fixed problem with saving path upon closing application
FIXED BUG: fixed problem with AF run number in “Scan details” window when option “Show all AF runs” is enabled
NEW: The text outputs of the “AF Run List” and “Temperature and Filter Analysis” have been separated into two TABS for better readability
NEW: For more than one filter the average temperature compensation factor is calculated
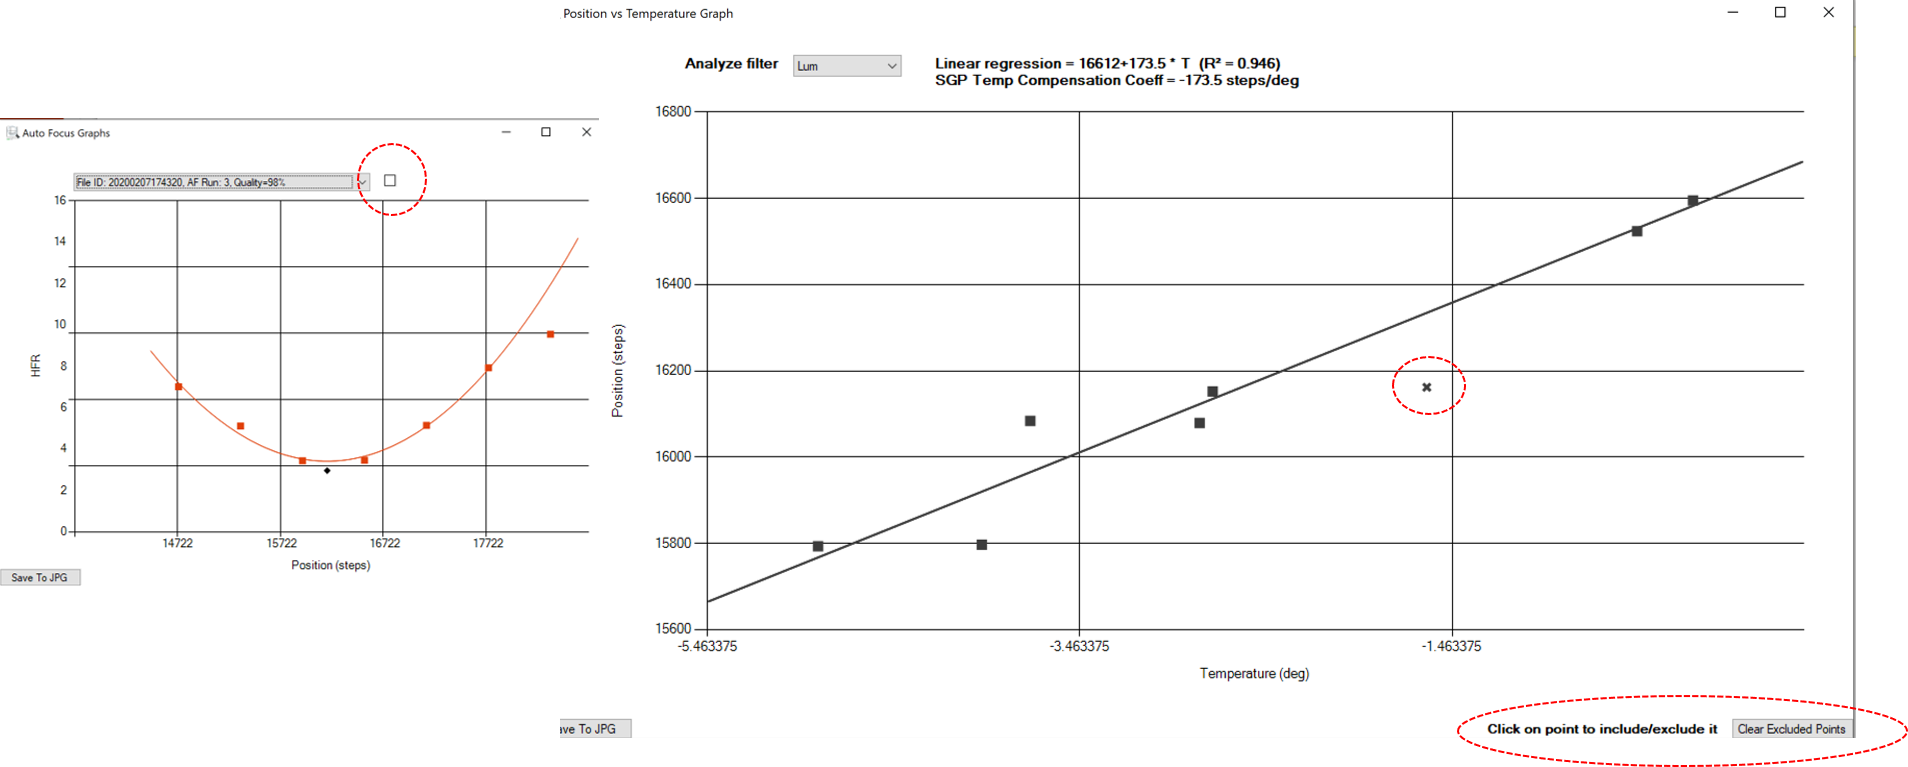
NEW: The ability to exclude/include AF runs for the temperature analysis has been re-inserted (it was removed when multiple filter analysis was introduced). This allows for excluding outliners. By click on a point in the temperature vs. position graph one can include (square symbol) or exclude (cross symbol) a point. The linear regression curve will be re-calculated and the text output in the “Temperature and Filter Analysis” tab will be updated. In addition, a check box in the corresponding AF graph will show if the Run is included or excluded. The checkbox can also be used independently to perform the same task. These features also work for multiple filters.
The way the last feature works is shown on this screenshot:
One suggestion, make the installation so that it overwrites the previous installation. I noticed that I had two previous installations that I needed to manually uninstall.
Yes I know this is a problem. The windows installer I use doesn’t appear to be able to handle automatic uninstall, at least that’s what different forums say and I didn’t find a way. So unfortuneately this will continue to be a problem. I will see if at least I can issue a reminder/warning about that during the install.
Actually, I recall that previously it wouldn’t install before uninstalling an old version, which forced one to uninstall. Then that stopped. I guess this is when I started putting in a proper version number in the installer, because now if you open add/remove programs in Win10 it will say the version numbers. A brute solution would be to set that version number to a constant 0.0.0 (not very pro ), but that probably will prevent one from accidently installing many versions of it.
It’s been some time since the last version, but here is an updated version with some new small features:
Changes to v1.26
FIXED BUG: handles new validation frame HFR message starting from beta 4.2
NEW: Options dialog which exposes some “advanced” options (these were previously only accessible through a command prompt option). The advanced options include:
Hyperbolic fit: the Logviewer will redo hyperbolic curve fits of all AF runs. The logfile must be reloaded!
Auto scale: rescales the x and y axes for each AF curve in the AF Run Graph window
Replay mode: allows to replay the AF run in SGP by showing the progression of the AF run in the AF Run Graph. Useful to spot issues such as bad “wings” of the curve. The logfile must be reloaded!
Automatic save mode: allows saving the data of each AF run to a file
NEW: Custom Color scheme, available in the Options dialog. Requires a restart of the Logviewer.
NEW: Tooltip feature, where some explanations of functions are explained by hovering with the mouse over the corresponding control.
NEW: HFR and Position of each data point in a AF graph can be seen by hovering the mouse over the point
NEW: Number of detected stars shown in the text summary
 ), but that probably will prevent one from accidently installing many versions of it.