I’ve uploaded a new 1.10 version of the AutoFocus Logviewer on SGP AutoFocus LogViewer download | SourceForge.net
This version includes some of the suggested changes. Here is the changelog:
- Summary output text TAB delimited
- Date and Time as first columns in summary output
- Toggling between graphs using up and down arrow keys doesn’t change Min and Max of X and Y scales
- The best focus HFR is highlighted on each AF graph with a black diamond symbol
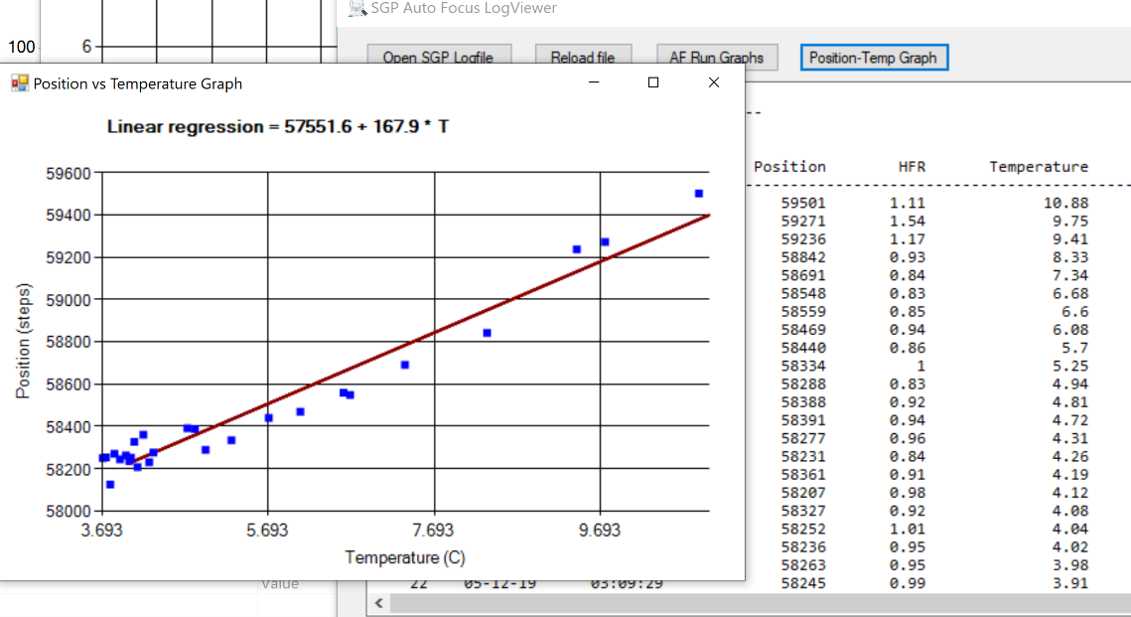
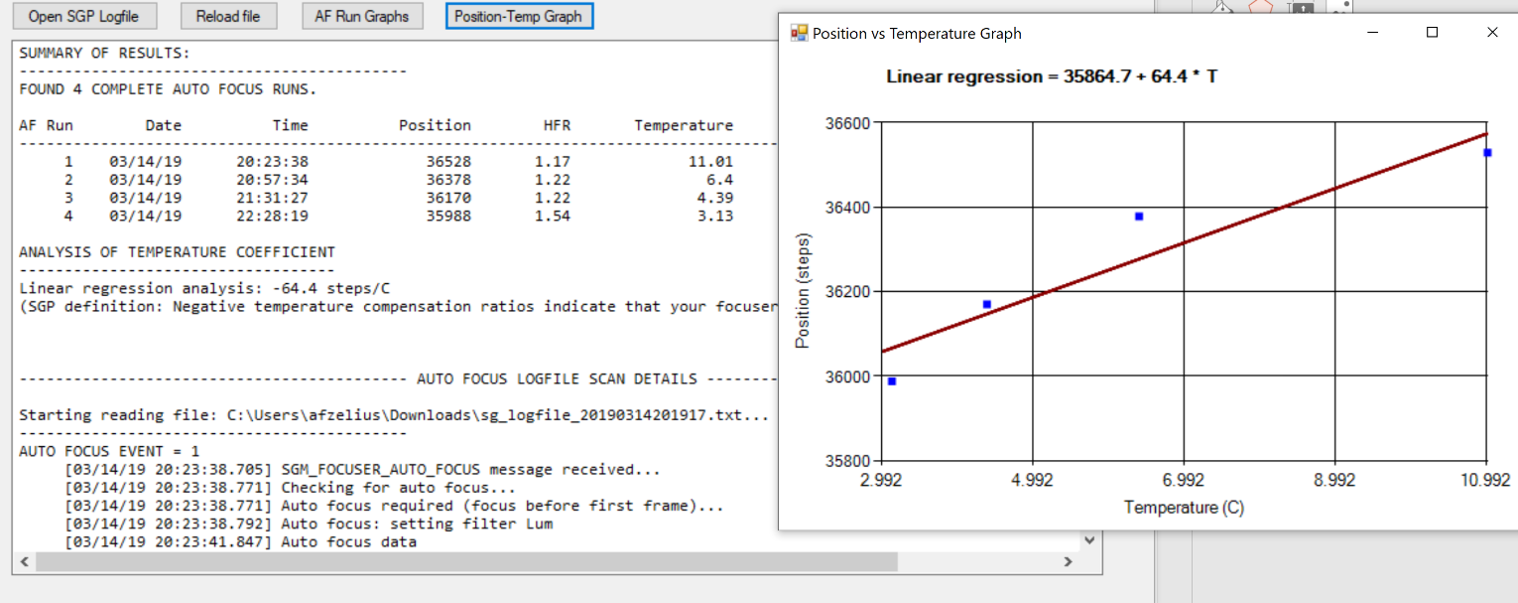
- A “focus postion” vs. “temperature” graph has been added. This feature also includes a linear fit in order to estimate the temperature coefficient. The fitted temperature coefficient is also printed in the Summary output using the SGP definition.
The last point needs some explaining. It was suggested by several people to add a column of temperature rates between AF runs. I tested that, but on most of the log files a ran it on (coming from users on this forum) the calculated temp coefficient between AF runs varied widely. But if one plots the best focus position as a function of temperature one can still often see a clear trend, provided that the temperature change is significant enough. So I decided to take the approach to fit that data using a linear model, and to plot the result in a separate graph.
As my setup has been out of commission for a few months I didn’t have the occassion to test this feature. But here are two examples coming from logfiles posted on this forum:
This one is a bit extreme, with a lot of AF runs over a large temperature range:
This is a more difficult case with only 4 AF runs, but the trend is pretty clear:
I would be very interested in any feedback on this feature, if it is useful or not in practice.
Cheers, Mikael