here are my logs - 22 in all most going all night using my Optec TCSF-3" focuser and SGP of course ![]()
What language have you used to code your routine? I now have the Quadratic fit routine fully programmed and operational in C++. I need to collect lots of examples of Position and HFR data pairs for example focus runs. Could you perhaps output those in a separate listing? That would really help me test the effectiveness of the Quadratic fit.
@jmacon Its coded with vb.net (Visual Basic in the .NET framework using Visual Studio). Basically I started programming again after a long >20 year pause because I needed to write an ASCOM driver. And the great video tutorials were done in vb.net …
The idea of outputting the individual AF runs data in a compact list is planned (or better to be saved in a text file), but I won’t make an official release in the near future as I have other ideas for improvements as well that I want to implement. The simplest and most immediate solution is that I make a quick modification where I replace the SGP log messages by such lists, and I send you this special version to you personnally. Please just don’t distribute it further.
This would be awesome Mikael. I look forward to it. I am processing some curves now, but extracting the data points manually is really tedious. With your modified version I will be able to automate this so I can quickly process a lot of log files. I have a couple of hundred of my own, plus folks will send me others to check out. We will be able to get some extensive testing of this very quickly. You can send it to jerry@maconsys.com
I’m not sure when or if sgp will use parabolic fits - but it has worked well for me for a long time and I do recommend it - particularly if you can include weighting on the measurements based on some quality metric such as the standard deviation in the spread of HFD values in an image.
But I think using R^2 as a quality metric is not a good way to go and it is much better to calculate the uncertainty in the calculated focus position. R^2 is inherently problematic by itself - but the big disadvantage when using it for focus is that it won’t let you compare different curves directly. You could have a very wide parabola that is an excellent fit to the curve, but the final focus value has uncertainty over a wide range of steps. In contrast you could have a noisy parabola measured close to focus with a poor R^2 but the resulting focus error is much tighter.
Disadvantages of R^2 are described here:
I provide the math for doing error propagation to find the uncertainty in focus is here:
https://www.astrogeeks.com/Bliss/OccultVideo/MultiStarAutoFocus.html
And note that the same math applies if you don’t have weights for each measurement. But having weights helps ignore values far from focus that may go haywire.
Frank
Here is an improved result for @bvalente. I adjusted the algorithm so most runs end up using the curve that includes all focus data points. Only curves with a worse than usual data point will exclude that data point.
I am very interested in whether or not your statement that R^2 is not a good quality measure for our focus curves is true or not. Some of the arguments this paper presents are not relevant for us.
What I have seen so far is that decent usable focus curves are producing R^2 values greater than 0.97, whereas the bad ones usually have a value less than 0.8. It seems to work really well as a quality measure to be used as the trigger for whether or not to do a re-run. I have examined about 50 focus curves from two different users.
Why don’t you send me some log files with some examples of what you are talking about. If it would improve my routine I am all for adding it.
It would be a big help if you could send me specific examples of these two conditions.
The point isn’t so much that R^2 is misleading - the main thing is that it doesn’t tell you what you really need to know - which is how confidently the focus is known - in terms of steps. You might use very large steps and get a very good v curve that matches a parabola well - but the expected error in the predicted focus is very large.
What I’m talking about isn’t earth shaking and it is standard procedure when fitting data to determine an underlying parameter. The fit not only gives you an answer, but it also gives uncertainties in the parameters. You can then use those uncertainties to calculate the uncertainty in what you are measuring.
If I say one focus value is 100 with R^2 of 0.9 and another is 120 with R^2 of 0.8 - what do I conclude? Compare that with one value giving 100 +/- 50 and another giving 120 +/- 5. The +/- comes directly out of the fit and carries much more info for comparing different curves and parameters.
You can do the calculation with your own data - I describe how to on the page I reference.
Frank
I just read through your paper on how to include error bars. This would clearly make the whole routine much more complicated. Let’s assume this were implemented. Is this going to change the recommended focus position, or just give us a new measure of the expected position error compared to the ideal?
If you would like to plug this into my routine, I will be happy to send it to you. It is coded in C++ under VS2019. I would have to see some proof that this would actually be useful, to encourage me to undertake it myself. The simplest proof would be for you to send me some focus runs where you have applied this, and I will do my simple Quadratic routine and we will be able to see what differences there are.
I don’t think the implementation is very involved - and it just needs matrix multiplication and inversion - which are directly available in python.
The parabolic fit is just a means to an end - and the goal is to find the focus value as calculated from the coefficients of the parabola. The R^2 gives you an idea of how well the model explains the data - but it doesn’t directly tell you how uncertain the focus value result is.
I’m confident that if only the R^2 were available, people would be comparing R^2 values and trying to optimize it. But it doesn’t tell you how good the actual focus result is - and it doesn’t tell you if a change of focus of X steps is significant or not. I would think that is sufficient proof right there of the benefits of the approach.
I’m mainly addressing people who are actually implementing autofocus routines - in particular if SGP were to do it. If you don’t think it’s worth it for your viewer that’s ok - but it isn’t a lot of math - and error bars are directly interpretable whereas R^2 is not.
Frank
@freestar8n I think there is a misunderstanding here. I will not include any quadratic fitting directly into the Logviewer at this point. The goal of the viewer is to show what SGP does during an automated session in terms of autofocus, and not to advocate changes in SGP. However, I support the efforts of @bulrichl and @jmacon to provide evidence that a quadratic fitting can improve SGP, by adapting my program so that they can more efficiently analyse large sets of logfiles using their home made AF routine. Basically my application would save lists of extracted focus curves that can be read by their application. For now that happens outside the scope of the “official” release of the Logviewer, but will probably be included in next release.
I think this thread has maybe gone a bit astray with respect to the Logviewer, and if you don’t mind I suggest that we move this discussion into the already existing thread on quadratic fitting started by @bulrichl, here: Proposal of a "Quadratic Fit" Auto Focus evaluation method - #18 by bulrichl - Auto Focus - Main Sequence Software
Thanks, Mikael
1 Like
Thanks again for this software! I have used it a lot lately to help people diagnose autofocus and calculate temperature compensation 
I wonder it would be possible to add an option to differentitate different filters when calculating linear regression?
Thanks Xplode! Good to hear it is useful.
This is planned for v1.2 yes, along with the ability to load multiple log files to get more data for the regression, if I can get to work without re-coding the thing completely. The timeline is probably 1-2 months for v1.2, I guess.
I am also about to upload a slightly improved v1.11 this week. It has one new feature for the Pos vs Temp graph, where one can now click on a point to remove it from the linear regression. This allows to exclude outliners. Could also be used too remove a particular entry with another filter, if you can identify that point in the graph. I will post a message here when I upload that v1.11.
Mikael
so badass. Thanks again for a great utility 
Brian
Just being able to exlude points will definitely help a lot
Here is version 1.11 of the AF Logviewer: SGP AutoFocus LogViewer download | SourceForge.net
Main changes include the ability to exlude/include points in the Position vs Temperature graph, “Target” shown in Summary output, and greatly reduced logfile loading time.
Mikael
Detailed changelog:
Version 1.11
- Fix: several minor bugs were fixed
- Fix: consecutive focus runs manually triggered by the “Rerun” button would be grouped into one big AF Run. These are now displayed as separate, individual AF Runs.
- Fix: loading times could be many seconds for large log files. Now the loading time is FAST.
- Change: the current target is now tracked through a sequence, and a “Target” column has been added to the Summary output. If the AF is triggered manually without running a sequence the entry will be empty.
- Change: data points can now be excluded by simply clicking on data points in the “Position vs Temperature” graph. The linear regression curve will be re-calculated and re-displayed in the form. This allows for excluding outliners. To reinclude a data point one can click on it again.
- Change: added a column showing potential warning and rerun messages. Possible messages are:
Warning = HFR validation frame warning
Rerun = manually triggered rerun
1 Like
I’m trying the quadratic fit focus routine tonight, i see some changed has to be done so the logviewer will handle the logfiles correctly
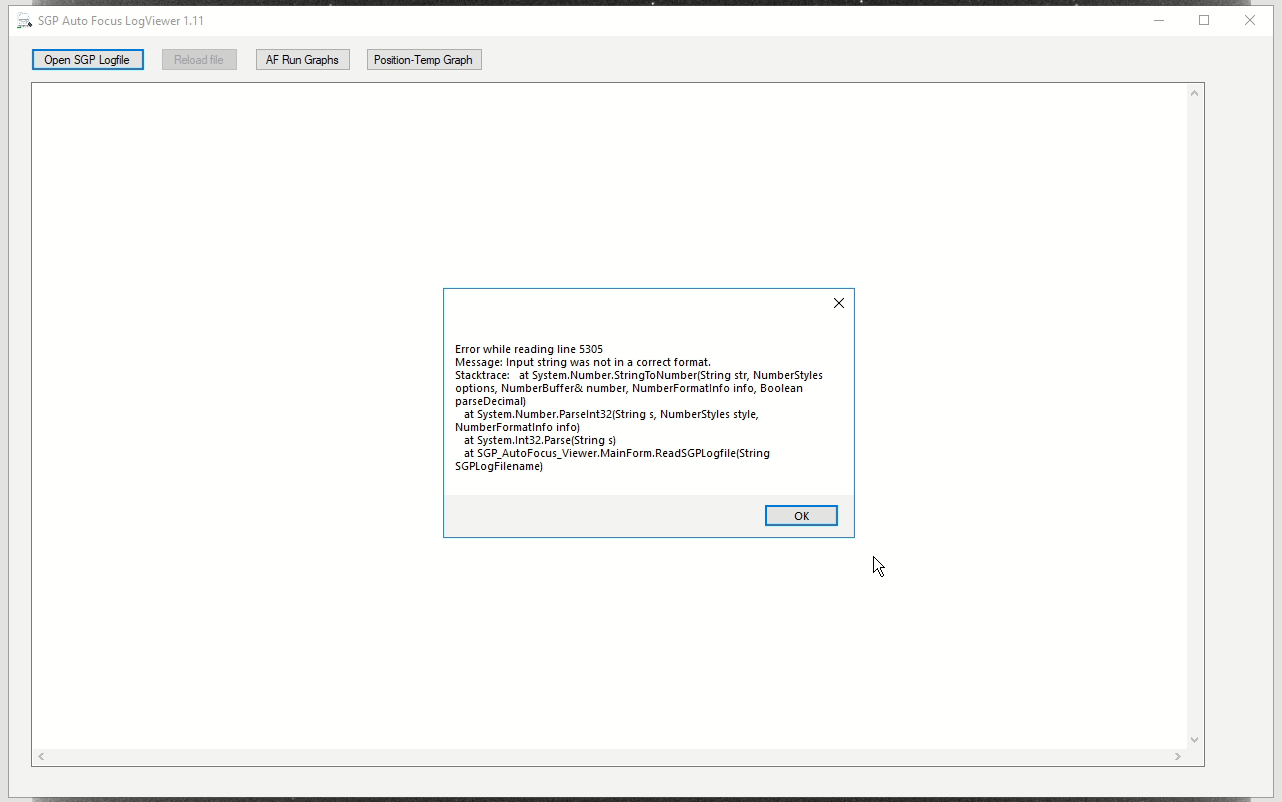
Here’s an early logfile from a couple autofocus runs
sg_logfile_20191012111055.txt (710.8 KB)
Before anyone goes crazy here… We have a debug log for AF that is turned off for the release. It is all JSON and would be way less fragile than bit-bangin around the main log file. I’ll post an example shortly. It is certainly not difficult to leave it on for the release.
Know what’d be even awesomer is if you could expand your program to figure out all the offsets for each filter and allow a selection to plop that data into the profile of our choice. Also I am sure you could calculate the temperature curve needed for temp compensation. Seems to me the hard work is already done.
Looks like an amazing app. Going to download it now.