QUADRATIC best fit Focus routine TESTING - SEND LOGS

We are testing a proposed new routine for determining the best possible focus position that each auto-focus run determines.
This routine is fully programmed and has already been run against 1000+ focus runs. The results from these runs show major improvements over the routine currently implemented in SGP.
But the 1000+ runs only encompass logs from 4 different users. It does include both Newtonians and refractors with both long and short focal lengths.

The improved results are very exciting, however, we need logs from many more users, particularly users that have been having difficulties with the current routine.
========== Please send us your logs ===========
Send logs through this forum as a download link, or directly to me at jerry@maconsys.com
If you send me your logs, I will send you back a text file detailing what this method would produce for your focus positions.

Who are we?
@bulrichl orginally started this project two years ago with his excellent presentation of the potential of the Quadratic focus fitting using LibreOffice. See “Proposal of a “Quadratic Fit” Auto Focus evaluation method”. He is programming LibreOffice to be able to output our vast collection of V curves on the same graph as the derived Quadratic curve, and thereby help us refine our logic code.

@mikaelA has created the “SGP AutoFocus LogViewer”, a fabulous program free to us all, that reads SGP log files and outputs wonderful plots of all the focus run V curves, and a linear plot of the best fit Temperaure line for the night’s focus runs. Now a special version of this outputs all the V curve data points into a TXT file that my program reads to determine the best Quadratic fit. Without this we could not process and analyze hundreds of focus runs in a reasonable period of time.

@jmacon I have programmed the Quadratic best fit routine in C++. That actually turned out to be quite easy, it is only about 60 lines of code. The more extensive effort has been programming the input of the data, and the output of analysis reports. The really time consuming part comes next, when you have sent us your logs and we analyze them in detail to make sure our code is coming up with the best possible focus values.

The program sequence we have developed allows us to process hundreds of Log files very quickly, and produce both summary and detail reports.
I should be clear on what it does and does not do.

A simple outline of what the SGP auto focus routine does is:

  1. take images over a range of focus positions surrounding the current focus position
  2. find stars and calculate their HFR in each image
  3. from this collection of Position-HFR data points, plot the V curve
  4. given the V curve data points, determine the best focus position (2 methods used)
  5. [FUTURE] allow a rerun of the focus run if some Quality Metric is not met

Our Quadratic focus routine only deals directly with 4) and 5). Basically 2), 4) and 5) are the steps where improvements can be made. Ken has indicated that 5) will be included in the current SGP release. I expect the Quadratic routine will make some improvement in 2), for those users where star detection is causing the problems. I expect this improvement because the V curves for those people are of a lower quality and therefore exactly the class of V curves for which our routine makes significant improvements. However, the major improvements in difficult star detection can only be made by the developers addressing 2).

The Quadratic routine provides the following two major improvements:

  1. provides a perfect Quality Metric (R^2) that the developers will need for implementing 5) above.
  2. gives a much better value for Best Focus Position for V curves that are less than ideal.

To be clear, the Quadratic and SGP give basically identical results for good V curves, which comprise the vast majority of all V curves produced by the SGP user base. Where Quadratic really shines is that small percentage (for most people) of focus runs that are not good V curves. My night’s run on July 17 provides good examples.

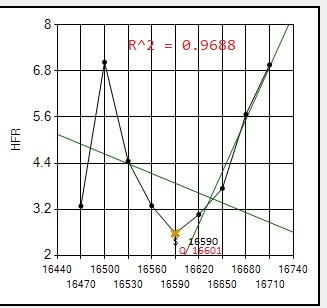
Here are all 8 focus runs on July 17 with my 12" Newtonian, an AG12 from Orion Optics, which show clearly where the Quadratic routine gives much better results. This scope/camera runs at .70 arcsecond resolution which increases the likelihood of difficult focus runs compared to larger resolutions.

NOTE: The letter S shows best focus position determined by SGP.
The letter Q shows best focus position determined by the Quadratic routine.
(the vertical position of the letter is meaningless, just its position along the horizontal (POSITION) axis indicates the best focus position)

RUN1_cr RUN2_cr RUN3_cr RUN4_cr RUN5_cr RUN6_cr RUN7_cr RUN8_cr
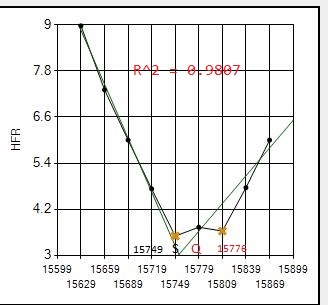
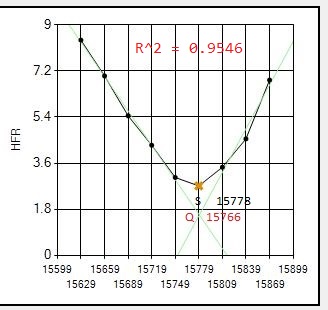
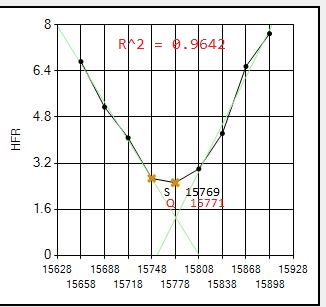
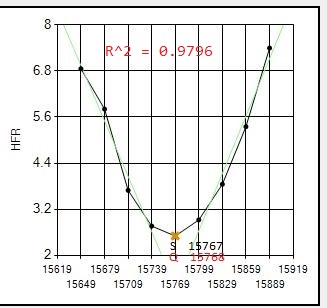
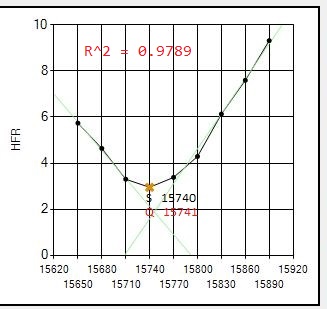
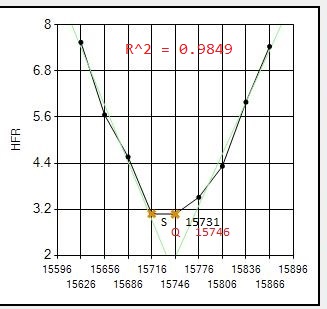
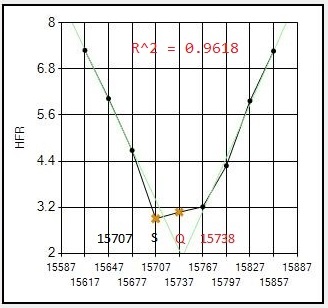
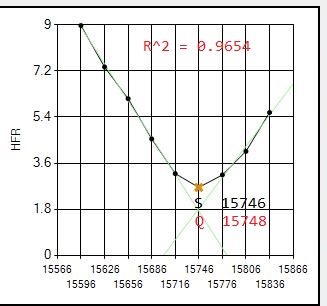
Note that out of the 8 focus runs that night, the Quadratic routine significantly improved focus for 3: #1,#6,#7. All 8 focus runs gave quality metric R^2 values > 0.96 so no reruns were required.

We have more proof this Quadratic fit method makes important focus improvements. Yes, it made much better choices for 3 out of 8 of my focus runs. But were they really improvements in actual focus? Here are the Temperature vs Focus Position plots for SGP compared to Quadratic:

TEMP_SGP

TEMP_Q
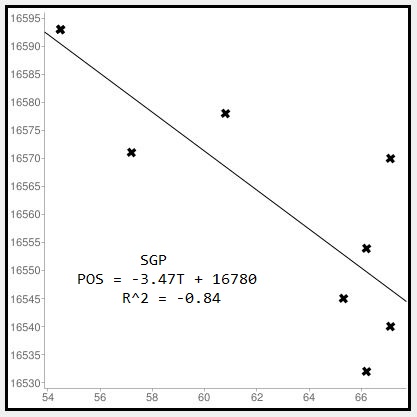
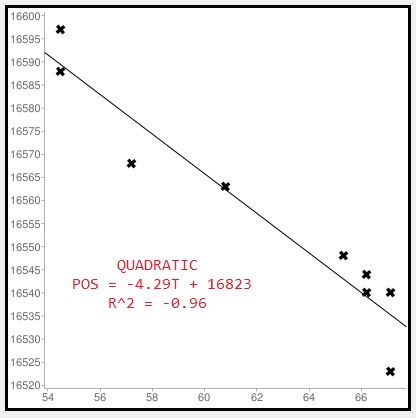
Major improvement in R^2 from .84 for SGP, to .96 for Quadratic. The fit of the least squares fit line is obviously much better, so we have a real improvement in focus positions.

Here are examples of focus curves with poor quality metric R^2 values that would trigger a rerun.

T0611-r1-zero_cr
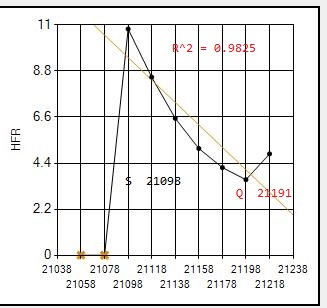
This is unfortunately a very common example where the starting focus point was so far out of focus that the last two images could not detect any stars and gave hfr=0. the SGP selected best focus point was actually at the worst possible focus. Quadratic actually made this an acceptable run with R^2=0.9825 because it threw the two 0 points away and only used the others, which form a very lop-sided V curve but otherwise a good quadratic fit. So the best focus quadratic returned was useable. However, in this situation we would probably want to trigger a rerun and also return a new starting focus position so that the rerun would be centered.

A0731-r5_cr
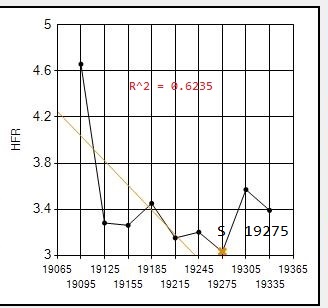
This is a fairly typical example of simply a poor focus run that more or less resembles the correct curve, but really warrants a rerun. The actual best focus based on the excellent focus runs on each side of it was at 19240, more than one full step increment away from the SGP value of 19275. Quadratic gives us R^2 = 0.6235 clearly triggering a rerun.

The Quadratic routine handles special cases well, like this example where one data point is really bad, but the rest of the points make a really good V curve. SGP does fine with this run.
RUN-IGNORE9_cr

Summary of results from our initial 1000+ focus runs:
The R^2 values are very effective in distinquishing betweeen good/excellent runs, and poor runs that warrant a rerun.
R^2 from .94 to 1.0 —> always excellent runs
R^2 from .90 to .94 —> somewhat choppy runs but usually very useable
R^2 from .75 to .90 —> very few fall in this range
R^2 from 0 to .75 —> really bad runs that require a rerun

Please note: R^2 has proven to be very effective in determining the key thing we want to use it for, deciding whether or not to perform a rerun. The user choice of where to set the break point is not a critical or sensitive point. Anything between .8 and .9 is likely to work just fine.

Hopefully with many more logs from users and much more testing, we will have this to the point where Ken and Jarod and the user base will be convinced of its effectiveness and will proceed to implement it. We will provide all the code to the developers. The quadratic routine is small and well packaged and should be straight forward to implement.

Additional suggestions for improvement are certainly welcome.

5 Likes

Good luck. I posted the same suggestion a few years ago, using a quadratic fit to establish a minimum. I’m not in a position to do focusing runs right now, otherwise I’d send some over. The ones that will interest you most I’m guessing will be the RCT, with a slight mis-collimation, which causes the slopes to be unequal.

Hi,

Thanks for the effort!

Sorry I cannot contribute with some focusing logs (I abandoned SGP couple of years ago because of the limitations of the built-in focusing routine), however I am looking forward to return to SGP as soon as a better/robust focusing routine is available or when it supports 3rd party focusing programs.

Any effort to improve the focusing routine is very welcome!

Cheers,

A couple of observations about this data. If you go back to the original FocusMax papers, they found that the slopes of the curve are linear except at the very bottom and that the slopes of each side are not necessarily the same. That would suggest that doing a quadratic fit might not be the best idea because a quadradic curve is not linear on the wings and it is a symmetrical curve. Looking at the samples #1,#6, and #7 it does appear (by eyeball) that if one where to do a better linear fit of the wings, you would also get a better focus result than SGP achieved. I also note that for those three examples, the difference between the S and Q result is not very large (60 steps in one case, 30 for the others). On my setup that difference would be almost identical focus. Thus I don’t find the argument for quadratic fit to be compelling.

It is true that the SGP approach needs some help but I think the effort should be directed toward getting a better linear fit for each side and calculating a “goodness” value to determine if the result is valid. As another poster has suggested, you can calculate the sigma of the HFR values for each exposure and use those values as a weighting factor for a linear fit. Perhaps the sigma value could be used to determine if a particular exposure should be redone.

While using a quadradic fit is tempting, it is not supported by the basic physics of the situation. With the treasure trove of data you are gathering, perhaps you could look for better linear fit algorithms. The SGP approach seems to work well with good data but falls apart with marginal data. Unfortunately, I imagine your data only includes the mean HFR value for each exposure and not the sigma so you won’t be able to test that approach.

The actual step difference given in these examples is not normalized, ie. not meaningful without comparing it to the step increment. In our analysis we are working with the difference as a percentage of the step increment. This 30 or 60 steps might correspond to 300 to 600 steps on your rig. What is your step increment? In the case of my example, my step increment is 30, so the difference is 100% to 200% of the step increment, a really big difference. Definitely significantly worse focus.

Actually a quadratic curve (which is a parabola) rapidly approaches a straight line as you go up the curve. That is why the FocusMax papers refer to straight lines. The lack of symmetry that can occur with our curves is definitely a potential issue that will need to be dealt with. And we can easily deal with it. A straight line approach would have the exact same problem to deal with. One of the reasons we need a lot of sample log files. Can you send us some that are asymmetrical?

The big problem with this approach is demonstrated well by the current SGP implementation. Trying to work with two linear sides involves tricky and arbitrary choices of which points to put in each line. In every example, quadratic does a much better job.

Not true. The basic physics is a parabola. Particularly around the bottom of the curve. What good are your straight lines?

1 Like

This is a misunderstanding. We have and are using all the data, which is all the focus data points of hfr at each position. We are calculating the full quadratic formula. I am not displaying the rest of the best fit quadratic formula on the graphs because these graphs are the graphs SGP created. I just plotted the only point we need, which is the center best fit position. This shows the improved focus point compared with what SGP now produces. It works perfectly as my examples show. If you doubt it will work as well with your data, and far better than the current routine, send me your logs and we will see.

Quoting from https://focusmax.org/Documents_V4/Statistical%20view%20on%20FocusMax_00.pdf
“Outside focus star diameters vary linearly with the focuser position”

I’m suggesting taking a clue from the actual nature of the data and find better fitting algorithms. The data is not a parabola particularly when the two sides are not the same slope. The fact that there is a small curve at the bottom does not make it a parabola.

In some cases, the SGP algorithm tries to do too much with too little data. Fitting a parabola to the data does not fix the problems with the data. It only gives the illusion of fixing it.

I’ve not used FocusMax but by all accounts it works quite well. Before attempting to focus you have to do a run to determine the slopes of each side of the curve and the delta between the lines intersection and the bottom of the curve. During a focusing run, FocusMax does not have to plot both sides of the curve. It interpolates the result after taking a few points and using the predetermined slopes. FocusMax only uses one bright star for focus which is both a blessing and a curse. A single bright star is subject to less seeing issues and you can do fast subframe exposures, however, it often requires slewing away from the target to a bright star. So my point is FocusMax works quite well using the linear slopes knowledge.

I don’t pretend to know the best way to fix SGP but I am suggesting that fitting a parabola is fighting the nature of the data.

The physics is that the light cone - which is what these plots show - is a hyperbola. I provided references in another thread. But if fitting to a parabola is easier then it won’t do much harm.

The main thing I’d take away from this analysis is that reporting the HFR as zero for images where no stars are detected is not a good idea. Reporting a high HFR or, better, not using that point would be more useful.

The second of the failed example plots doesn’t show anything that can be used to determine focus, one point with a high HFR with the rest showing more or less the same HFR varying apparently randomly.

The last failed graph shows a situation which is part of the problem, the SGP HFR detection falls apart if slightly out of focus. In this case the left hand point should have a HFR of about 9 but it’s 3.2. The first failed graph also shows this where the two zero points should be about 13 and 15.

I think the essential is to detect that the HFR determination is giving bad data and to manage this in a better way.

But what I think is really needed is to be able to get star sizes reliably even when well out of focus. We can see star discs or doughnuts when a long way out of focus so there’s a prospect that a different algorithm could do this.

As for using the variance in HFR as a measure of quality I think that the main influence on HFR will be star brightness. Bright stars will be larger. Experimenting will be needed, is the data on star brightness, HFR and ideally position in the frame for each star available?

DesertSky and Chris,

I think that your comments on the quadratic fit method are out of place here, they would have been much more suitable in the original thread, Proposal of a "Quadratic Fit" Auto Focus evaluation method - Auto Focus - Main Sequence Software . Please post your comments regarding the method there, and not here.

The purpose of Jerry’s request is to motivate users who are discontent with the currently used algorithm of finding best focus in SGP to send some logfiles in which the best focus obviously was not found in spite of half-decent focus curves. He would feed the data measured by SGP (i.e. focus position and HFR values of the focus frames and best focus determined by SGP) to our algorithm and send back a detailed report to the sender that contains the result determined by our algorithm. This approach is completely transparent: each sender can get an idea of whether an improvement would be achieved or not.

Jerry did not intend to open a new thread in which the pros and cons of a quadratic fit are discussed in detail.

Therefore I am somewhat disappointed. I think it is a pity if users are deterred from sending logfiles by your comments. The telescopes that are used by SGP users differ strongly (e.g. type, focal length). How shall we be able to test our algorithm without having data that cover the whole spectrum of telescopes?

I want to stress further advantages of our algorithm which Jerry forgot to mention:

  • the recommended AF step size for the quadratic fit algorithm will be reduced most likely (estimated: to 60 - 70 %), so the donut issue will be less severe (important for long focal length),

  • automatical rerun with corrected starting focus position when the first AF run was not performed near best focus (point 5 in the list of tasks of the AF routine; this would profit considerably from the quality criterion).

I hope that the response to this request will increase. I did not expect and cannot understand such reservations about sending logfiles.

Bernd

1 Like

This and your other points are spot on. Yes, the physics is one arm of a hyperbola, but at our use near the vertex they are very close so fitting to a parabola gives very similar results. Telescopic focus data is not precise enough to show a difference. Proof is presented above. It works, and it works perfectly. What’s not to like?

And our quadratic routine accomplishes this perfectly.

Also and most importantly, it is programmed and ready to go. (Well, it will be if you folks that are complaining about focus not working for you would send me your logs).

I have 1539 focusing runs on my C drive. They are all from an iDK 14.5" and OPTEC TCF-S3i focuser.
I’m one of those that have experienced very few failures of the SGP focusing routine and, when they DO happen, it’s usually because of cloud! So, the overwhelming majority of these runs will be flat out, boring repeats of the better examples already seen here but with min. HFRs of 0.6-0.8. The Focus Log folder runs to 2.86GB! It is at this link: Dropbox - File Deleted

Could you provide that reference again? Thanks

Thanks Terry for sending the focus packs. I unpacked them and you have a lot of fine examples here. Do you have the Log files for those nights? The Log files are what we need because they contain all the data for the focus data points and the resulting best focus value determined by SGP. The focus data points are displayed on the graphs, but we can’t import that data into our program.

Sorry to report that I have no saved log files. Not sure why I
set and then entirely forgot I was saving AF packs in the first
place…

The various discussions about parabolic or hyperbolic curves ignores the fact that these are symmetric curves and that focus curves are known to be, in general, asymmetric. Both the SGP and FocusMax use linear fit algorithms that handle the asymmetry. Anyone doing research in this area would be well advised to take this asymmetry into account and not indiscriminately apply a symmetric curve to the data.

I am, in fact, just today refining our logic to deal effectively with asymmetric curves. Curves that are asymmetrical require an adjustment based on the degree of asymmetry. I can determine that degree of asymmetry and make an effective adjustment. I can do this within the quadratic framework, and will post examples shortly. I have some but not many asymmetric curves to test on, so again, please send Logs, particularly if they have asymmetric curves. Do you have any @DesertSky?

1 Like

Nope, gave up on SGP focusing a long time ago. A bahtinov mask works just fine and my setup does not seem to be very temperature sensitive.

I’ll be interested to see how you plan to coerce a symmetric curve unto asymmetric data.

Hi Jerry,

good to hear of this new development.

I have sent you one file (the only one currently available) and posted your request and a link to this thread on two Dutch astronomy forums:

http://www.starry-night.nl/forums/topic/sgp-autofocus-logfiles/

So hopefully this will result in more data.

NicolĂ s

1 Like

Thank you NicolĂ s, and all the other folks who have sent me logs directly via email. These are proving very helpful, particularly by providing great examples of problematic curves.

NOTE: when you send me your logs, it is very helpful if you include this data on your rig: telescope type, focal length, pixel scale.

Simply bad curves due to factors like weather are already handled really well by quadratic. They always have a bad R^2 and will trigger a rerun.

The major category of problematic curves is Asymmetric curves, as several folks have mentioned.
Asymmetric curves are of two types:

  1. best focus point is very off center
  2. best focus point is centered, but the wings consistently have very different slopes

A strictly applied quadratic fit will not return optimum values in these cases, because a parabola is symmetric but our data is asymmetric. SGP generally solves 1) by just selecting the low point of the curve, in other words, special treatment.

Quadratic will also need special approaches to effectively handle these special cases. I have come up with elegant approaches to accomplish this, and I am now in the process of implementing these. I would guess a couple of days at the most. After which I will be sending results to the folks who have sent me logs.